The State of Women & Children's Health, Live
The Architecture
of Harm
Episode 1 · Maternal Mortality & Infrastructure
Dr. Yamicia Connor · Eevie · Walter
The frame · what Architecture of Harm is
The medicine exists. The infrastructure does not.
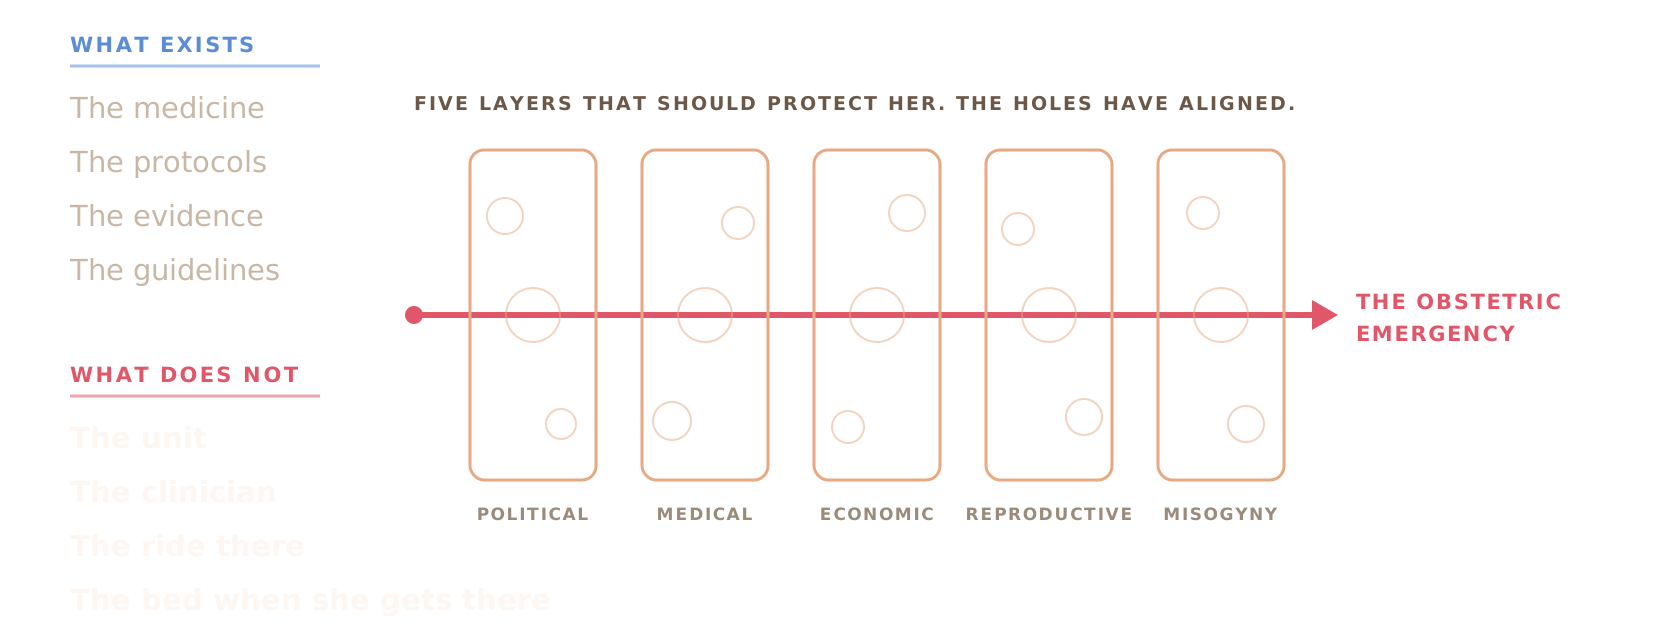
Architecture of Harm is the report: 37 research domains tracked weekly, 16 chapters, tonight the first two. The layers are the Swiss-cheese model of accident causation (Reason, 1990), the same figure as the Reproductive Justice & AI salon.
The thesis · a century, eleven countries
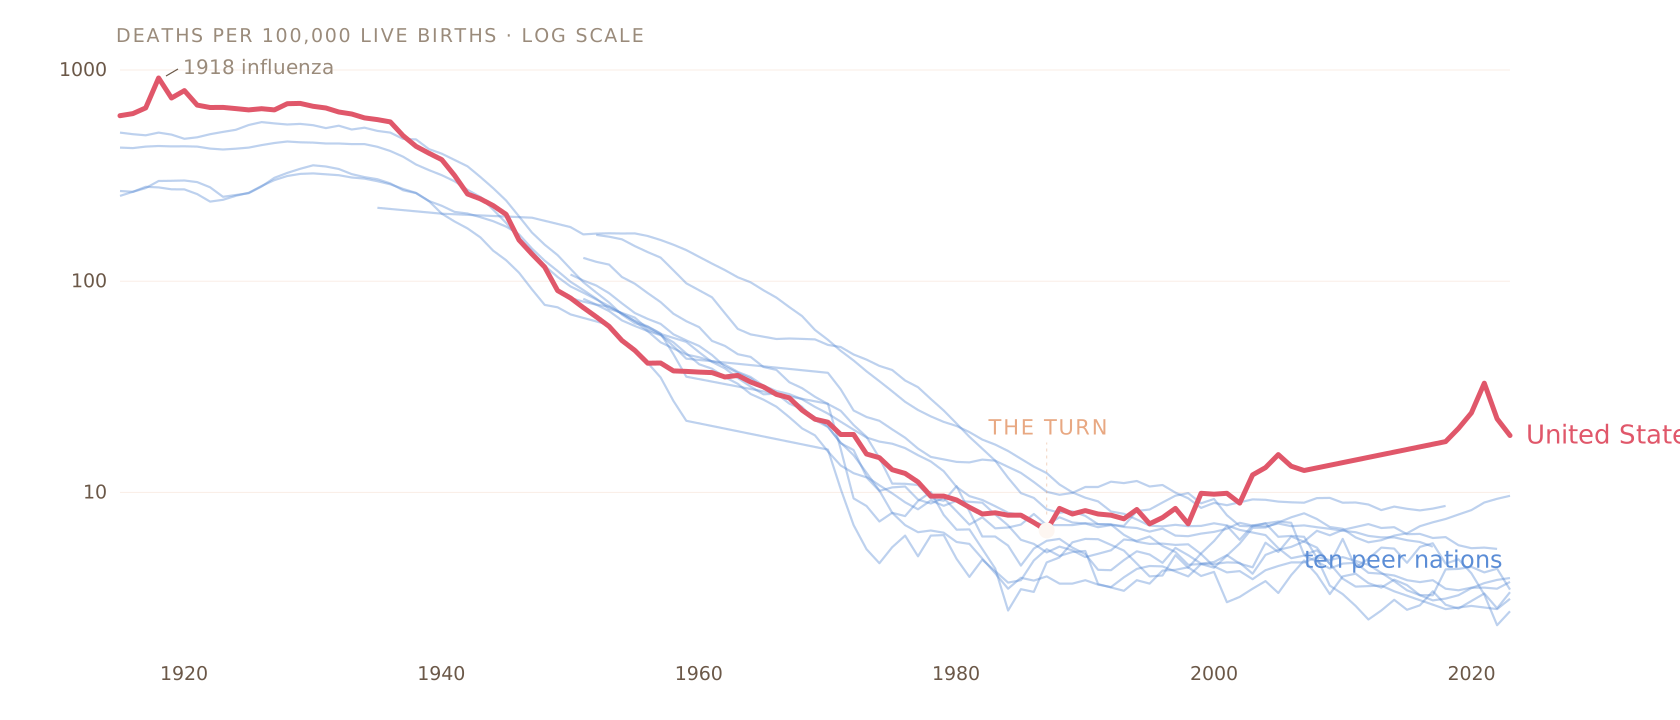
Everyone fell. Then we turned and climbed.
Deaths per 100,000 live births, log scale, 1915–2023. Rebuilt from the series behind the Clinical Intelligence divergence figure — historical 1915–1959 and the comparable modern series to 2023. Peer lines carry a centred five-year mean for legibility; the U.S. line is unsmoothed annual data.
Why this matters to you
She starts bleeding at the cabin.
1,902
counties with no practising obstetrician
500+
maternity units closed since 2010
43%
of Idaho's OB-GYNs, gone
1,902 of 3,139 counties — three in five — have no practising obstetrician; 7.7 million women of childbearing age live in one, and in majority-rural counties it is 78 percent. Our own county map, Clinical Intelligence. Architecture of Harm, introduction and chapters 1–2.
Why it matters for the nation
When infant mortality rises, it is not because babies got sicker.
It is because the nation got weaker.
The arc
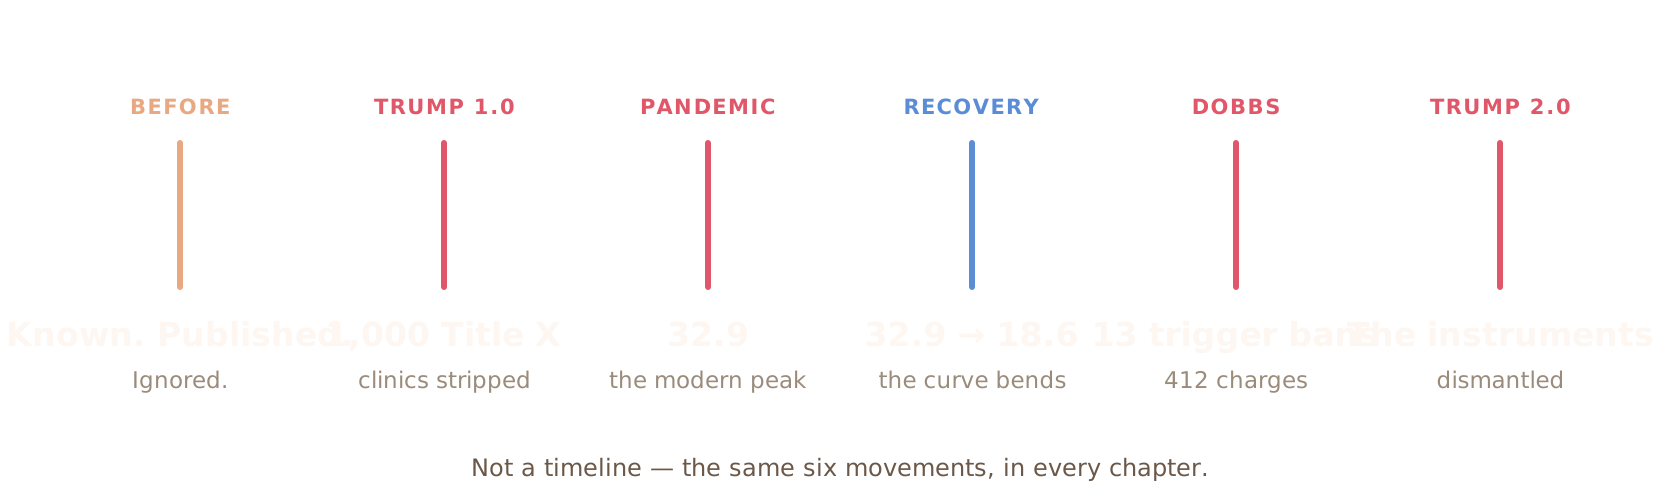
Every chapter traces the same arc.
Architecture of Harm, introduction and chapters 1–2.
The number that reframes everything
The leading cause of pregnancy-associated death is homicide.
3.62
per 100,000 live births
>
every obstetric cause combined
Wallace M et al., Obstetrics & Gynecology 2021 (NCHS data). Overdose is the leading medical cause since 2020 (+81%, 2017–2020); mental health conditions are involved in 23% of pregnancy-related deaths — CDC/NCHS.
Before · alone among wealthy nations
At our peak, eight times Sweden.
Every peer in low single digits.
84%
of these deaths are preventable
+26.6%
U.S. rate, 2000–2014
none
of its peers rose with it
Deaths per 100,000 live births, 2021 — the U.S. peak — all four from OECD Health Statistics, the same series as the opening chart. The U.S. rate rose 236% from 2000 to that peak, over a span in which every peer above fell. 84% of U.S. maternal deaths are preventable (CDC Maternal Mortality Review Committees, 84–93%).
The racial chasm
The worst outcome in the country is the one least often cited.
Deaths per 100,000 live births, 2021 — the one year all three groups are published, so the three bars are the same series. CDC/NCHS. Native women are ~1.3% of U.S. births, and NCHS suppresses any rate built on fewer than 20 deaths, which is why the worst outcome is the least often cited.
Wealth is not a shield
Above $100,000 and still dying faster
$15
of Black wealth per $100 white
>$100k
and still dying faster than white women in poverty
54%
report discrimination this year
Architecture of Harm, chapters 1–2. Wealth gap 86% in 1992, 85% in 2022. Black women carry $58,252 in average educational debt against $29,323 for white women, and are up to 50% more likely to experience severe maternal morbidity.
The drivers of Native maternal mortality
Funded at less than a third of the national average
Indian Health Service
$4,078
Indian Health Service, IHS Profile fact sheet (Oct 2024, 2022 data), against CMS national health expenditure per capita. Physician vacancy runs 29% across IHS facilities; 93% of AI/AN pregnancy-related deaths are judged preventable. 3,406 Native women were sterilised by IHS 1973–76 across four of its twelve regions — GAO HRD-77-3 (1976).
The proof
General inequality would converge. These diverge.
Ratio to the white rate
All-cause
Maternal
Native American / Alaska Native
2.3×
4.9×
The maternal gap is more than double the all-cause gap.
All-cause, among women of reproductive age: Native 220.5 and Black 133.3 against a white rate of 94.9 per 100,000. The maternal gap is more than double the all-cause gap for both.
A note on the numbers
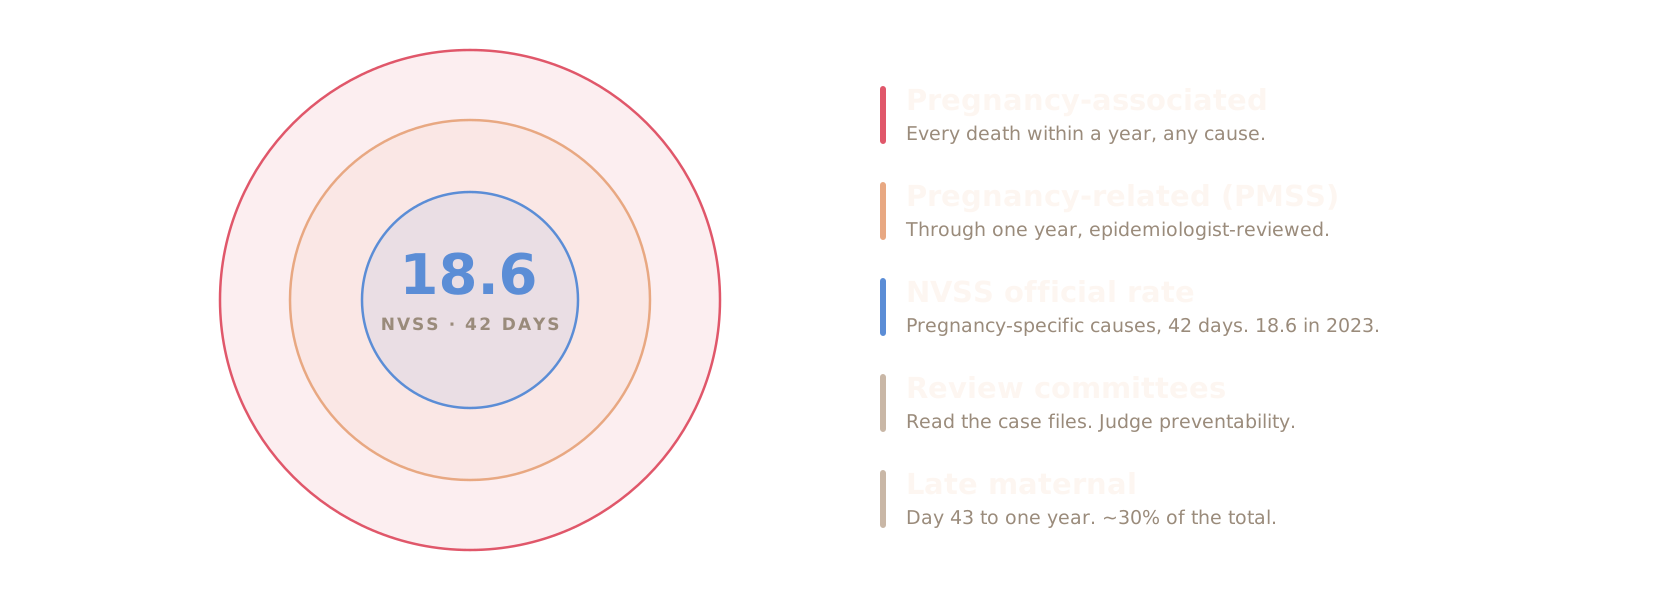
Five legitimate numbers. Five different questions.
Never read a trend line across 2018: the death-certificate pregnancy checkbox phased in state by state 2003–2017, and NCHS suppressed the national rate during the rollout.
Age and the mortality gradient
Nearly five times the rate for women under 25
Deaths per 100,000 live births · CDC/NCHS, 2024 and the pandemic peak.
The pandemic
A system with no surge capacity meets a surge
69.9
Black mothers, same year
46%
rise where Medicaid was refused
Deaths per 100,000 live births. Against a 21% rise in expansion states. Eighteen rural maternity units closed in 2020 alone — Architecture of Harm, chapters 1–2.
What began to recover
The curve bends when the infrastructure is supported
Deaths per 100,000 live births · CDC/NCHS provisional maternal mortality (VSRR). 48 states extended postpartum Medicaid from 60 days to 12 months; Title X was restored and EMTALA guidance clarified. Black maternal mortality ran 69.9 → 49.5 → 50.3 — still 3.5× the white rate.
Dobbs · June 24, 2022
Ban states now run 62% higher maternal death rates
Deaths per 100,000 births. 21 states banned or severely restricted within weeks; bans in 14 states produced 478 additional infant deaths, 265 of them Black infants. A total national ban is estimated at 140 additional maternal deaths a year — +21% overall, +33% for Black women.
These women did not die of abortion
Six names. Six different patients.
Amber Nicole Thurman
28 · retained products of conception
Candi Miller
41 · retained products of conception
Josseli Barnica
28 · inevitable pregnancy loss
Nevaeh Crain
18 · previable infection
Jaci Statton molar pregnancy · Mylissa Farmer previable rupture both lived
Reported by ProPublica; preventability findings are the states' own review committees. Photographs as published with that reporting — family photographs of Thurman, Miller and Barnica; Crain's senior portrait. The treatment for each of the six uses the same instruments and medications that also end pregnancies.
Box A · retained products of conception
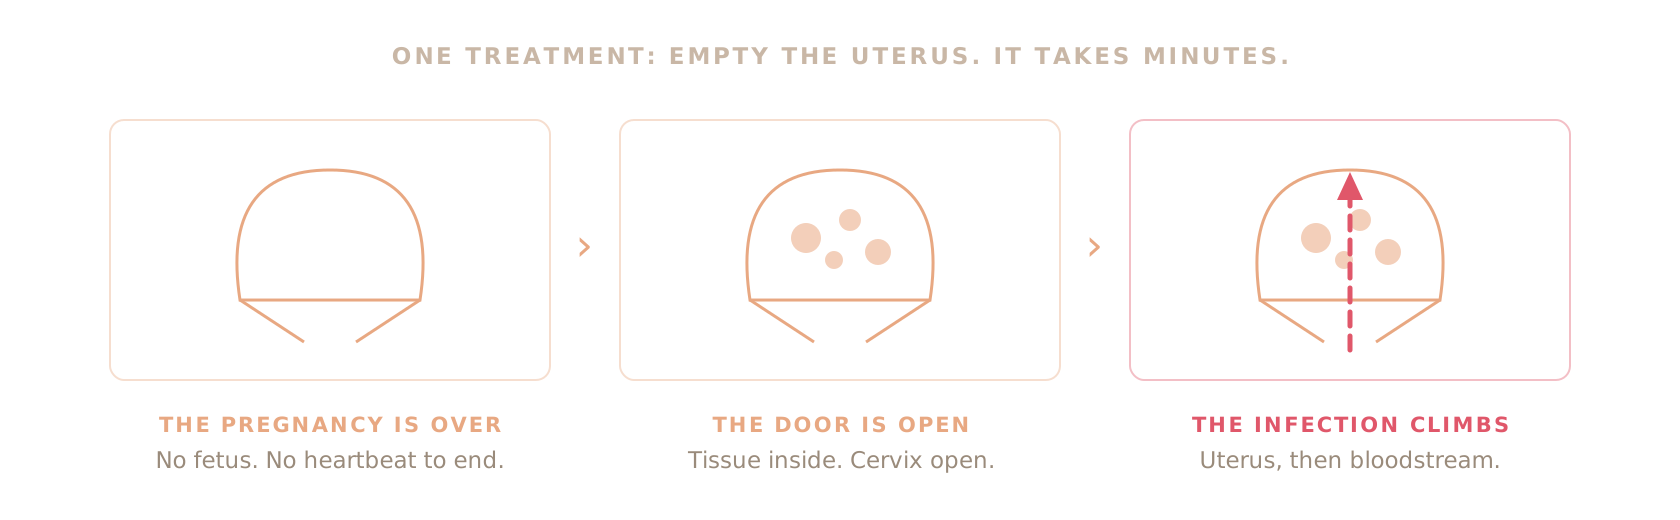
There is no heartbeat to end, because there is no fetus.
The mechanism behind the deaths of Amber Thurman and Josseli Barnica.
Box B · previable infection
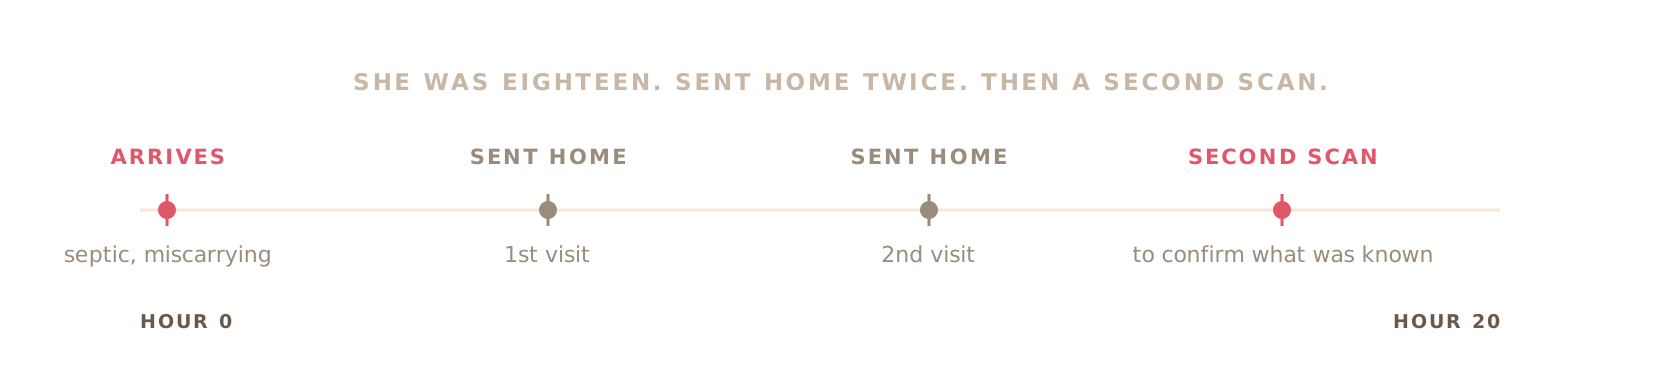
That second scan was not medicine. It was a legal ritual.
There is no clinical reason to confirm demise twice before treating a septic patient.
Box C · the speed of sepsis
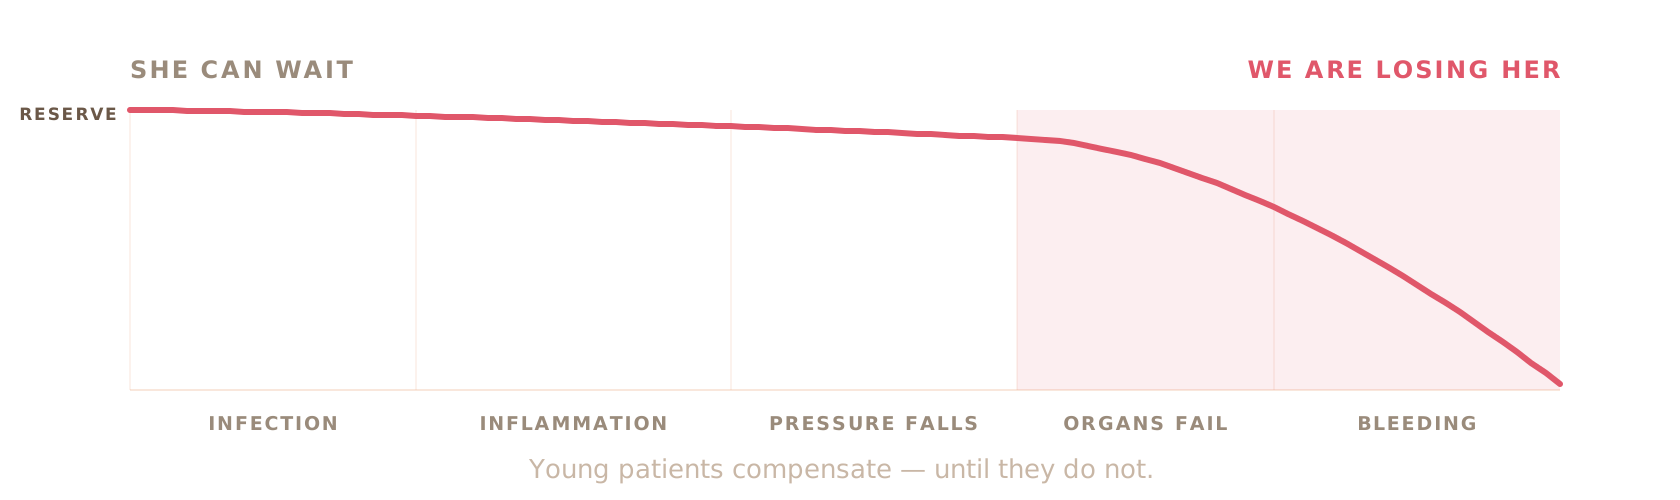
The bans legislate as if she had time.
Why a twenty-hour delay is not a scheduling footnote but a cause of death.
The state accounting · Texas
Same state, same law, different reading.
Second-trimester miscarriage sepsis, 2019–22. Houston hospitals read the ban most restrictively; Dallas hospitals revised their protocols. The variable is the institution, not the statute. Texas maternal mortality rose 56% over the same span, five times the national rise, and deaths from 2022–23 were never reviewed.
The criminalization of pregnancy
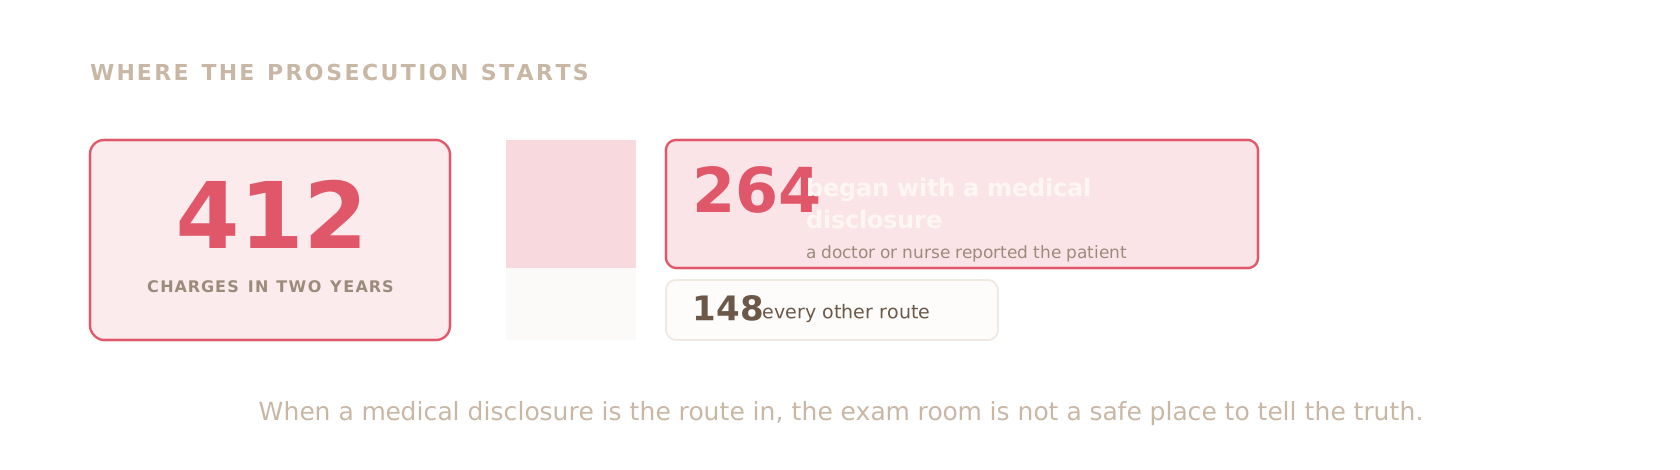
264 of 412 cases began with a medical disclosure
Charges doubled year one to year two; Alabama 192, Oklahoma 112. 75% of defendants were low-income and 97% of charges included substance-use allegations. Prenatal visits fell 40–60% in border regions.
Trump 2.0 · the instruments
The instruments that measure the damage, dismantled.
Apr 2025
the PRAMS team, fired
$223.5M
NIMHD grants, terminated
$113.5M
review committees, the one thing renewed
HHS transformation fact sheet (27 Mar 2025) · STAT News, 11 Apr 2025. PRAMS had run 38 years across all 50 states; the NIMHD cut is 77 grants. Two of three branches of the CDC Division of Reproductive Health are gone, and AIM is slated to follow.
The 2024 breakdown
The decline is carried by two groups.
Per 100,000 live births
2023
2024
Non-Hispanic Black
50.3
44.8
Non-Hispanic white
14.5
14.2
Non-Hispanic Asian
14.5
18.1
Native American / Alaska Native
—
suppressed
National rate 17.9. Asian women rose 24.8% in a single year and it does not appear in most public reporting. Native rates are suppressed, not unavailable — NCHS withholds counts below 20. 2023 is the last year of reliable national data.
From the clinic · the infrastructure
She needs a neurologist.
We don't have one.
De-identified, from Dr. Connor's own dictations · published in the Architecture of Harm report as From the Clinic.
What is left to provide the care
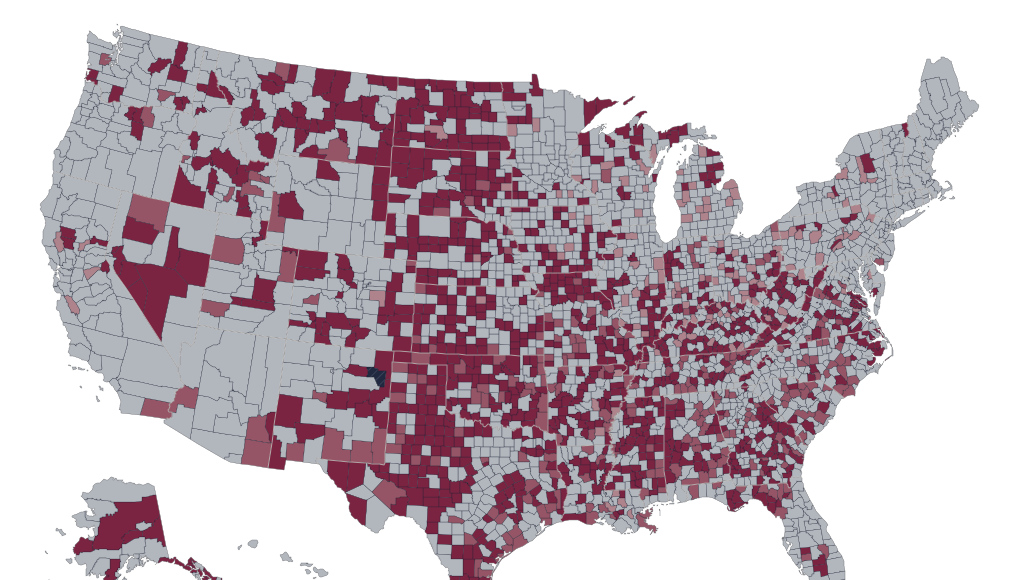
1,902 counties have no obstetrician
1,902
of 3,139 — three in five counties
7.7M
women of childbearing age live in one
Full access
Moderate
Low
Maternity care desert
1,902 of 3,139 counties have no practising obstetrician — our own county map, Clinical Intelligence. In majority-rural counties it is 78 percent. The stricter maternity care desert — no obstetric hospital or birth centre and no obstetric clinician — covers 1,023 counties, about one in three; the shading here is that stricter measure. 330 obstetric units have closed and the pace has not slowed since 2020.
The rural geography of death
42% higher, and the excess is where minutes decide
Deaths per 100,000 live births · obstetrician density across all 3,139 U.S. counties · CMS facility data. 60% of the excess is haemorrhage and hypertensive emergency — both time-dependent, and 64% of rural counties have no OB-GYN.
The workforce
Twelve years to replace one. No shortcut.
22,000
projected short by 2050
NRMP Main Residency Match · ACOG · HRSA. Only 19% are under 40. Residency applications fell 10.5% across ban states — Alabama 21.2%, Missouri 25%. Sixty percent of physicians in total-ban states considered leaving, and 42% of abortion providers have relocated.
The parallel collapse
Maternal suicide leads the first year postpartum
<500
reproductive psychiatrists
96%
live in a shortage area
For ~3.6 million births a year; 58% of rural counties have no specialist at all. One in five women has a perinatal mood or anxiety disorder. $2B in SAMHSA addiction and mental health grants was terminated, against a 77,050-counsellor shortfall projected by 2038. Rural opioid-involved maternal mortality runs 43% above urban.
What the system does when it is run on purpose
4.0 against 58.1 — under the same federal law
Deaths per 100,000 live births · state maternal mortality review committees. California cut its rate 55% through the Maternal Quality Care Collaborative — and Black women there still die at three to four times the white rate, with only 17% of hospitals complying with the 2019 racism-in-medicine training law. In Louisiana, 59% of Black maternal deaths are preventable against 9% of white deaths.
From the clinic · a Monday morning
The clinical note becomes a safety plan.
The prescription pad becomes a resource list.
De-identified, from Dr. Connor's own dictations. This is a Monday morning.
Architecture of Harm · Episode 2
Funding, and the
Safety Net
What was cut, and who loses
Dr. Yamicia Connor · Eevie · Walter